
Appearance
The purpose of this document is to provide a high-level strategy for the development of the Farm Flow software platform. It will include practical recommendations for how that strategy may be implemented and how it will achieve the desired outcomes of Farm Flow's various stakeholders. Runrig consulted with Fitzgerald Organics, Cloudburst Studio, and the 11th Hour Project to gather feedback and insights to their objectives. Aspects of business development, technical feasibility, ecosystem impact, user experience, and the specific design requirements have all been taken into consideration.
It is precisely this varied collection of interests and goals that must somehow be synthesized into a single, coherent strategy with actionable recommendations. With that in mind, I'd like to offer this provisional summary of Farm Flow's main motivations and the purpose of the software project as a whole.
Summary of Farm Flow's Main Motivations & Purpose
As a software platform, social enterprise, and knowledge ecosystem, Farm Flow provides a comprehensive solution for crop planning, team management, and operational analysis, serving farms of all shapes and sizes. A key value proposition is the Farm Flow Board, a visualization of all the field tasks to be carried out for every crop on the farm, as well as Standard Operating Procedures (SOPs) that prescribe how each task is to be performed. With these utilities in hand, team members can coordinate their activities to achieve targeted production volumes, desired costs savings, and positive environmental impacts. As a wider community and a forum for exchanging knowledge, Farm Flow also connects farmers to agronomists, technicians, designers, and other stakeholders, activating new channels for collaboration and innovation.
No doubt this glosses over many of the finer points and perspectives, so I invite any suggestions on how to improve this statement as development proceeds.
Strategies & Recommendations
The strategy I recommend can be broken down into the three constituent strategies that follow, with a dedicated section below presenting the full rationale and practical recommendations for each:
- Focus on Core Competencies, namely The Farm Flow Board and SOPs
- Actively Promote Data Portability
- Embrace Software Freedom as a Business Model
Focus on Core Competencies
Ten years ago, the range of mature software available to farmers for managing their operations and production was quite limited, with few options for even the most general applications, like crop planning, team management, and task scheduling. Today, that is no longer the case. There now exist redundant offerings for most generic use cases, even when considered across market segments based upon price, farm type or scale, and platform support. Among open source and free software alternatives, too, there exist several mature options, such as LiteFarm, farmOS, and Brinjel, all of which provide robust solutions for relatively low cost or for free.
In light of this, a stated aim of Runrig's preliminary discovery work was to:
Identify the core competency of the application that will most immediately add value to the user's existing workflow, without reproducing functionality that already exists in other applications.
The two strongest core competencies of Farm Flow that Runrig has been able to identify are the Farm Flow Board, as a unique visualization and user experience, and SOPs, as user-defined algorithms that belong to those users.
The Farm Flow Board

The first core competency is of course the Farm Flow Board itself. It presents a unique and comprehensive view of the farm's crop plan with the many field actions it requires over the course of the season. To highlight the structural qualities that offer the most distinct value to the user:
- Event-based vs Duration-based Elements: Unlike most Gantt charts, the primary visual elements populating the board are the pinpoint activities that punctuate a moment in time, not the durations intervening between the start and end of an activity.
- The Horizontal Axis: Each row is an integral unit of the board, representing the planting of a particular crop at a given location. An important aspect of each row is the sequential nature of the several activities that can occupy the cells. A complex set of dependencies governs when each activity can be scheduled, based on such factors like the amount of time since the previous activity, recent weather events, and overall progress and maturation of the crop.
- The Vertical Axis: At any moment during the season, there will be a cluster of columns representing recent and upcoming calendar dates that focuses the user's attention. The field activities within this cluster present a sort of "wavefront" of significant data points: it is the critical decision window at any moment during the planting season. Because the rows are grouped by the geographic proximity of crop location, shifting one's attention up and down a column corresponds loosely to the distance between crops. There is an aspect of directionality along the vertical axis, too, since moving vertically towards or away from a given row on the board corresponds to real movement to and from locations on the farm. This is most conspicuous when observing the rainfall amounts for one day (a single column) and how they rise and fall in a relatively smooth gradient up and down the column. When this vertical directionality is combined with the direction of time inferred by the horizontal axis, it offers a unique opportunity for representing these gradients across the 2-dimensional plane of the board, as expounded below.
Heat Map vs Gantt Chart
One way to analyze the visual and geometric relationships of the Farm Flow Board is to view them as a 2-dimensional vector space or gradient field; the distance between any one row or column and another correlates to some measurable distance between two different times and locations on the actual farm, as well as the direction to and from each other. Along the horizontal axis, this is the length and direction of time, in a linear 1:1 relationship with actual calendar days. A less strict, but approximate relationship exists along the vertical axis, too, correlating to distance between locations on the farm. The magnitude and directionality of values along both axes is one subtle way the Farm Flow Board differs from most Gantt charts and crop planning visualizations, where often such a correlation only exists along the horizontal.
What makes the Farm Flow Board most distinct as a visualization, however, is that the key time elements on the chart are not extended durations of time but rather pinpoint events separated by intervals – that is, not the typical "bars" used by Gantt charts and most crop plans, but markers that represent discrete instances of activity. This allows for the interval between events to be represented as a gradient rather than as a solid block, and such a gradient can be applied two-dimensionally in both time and space. Further possibilities emerge if other properties like growing degree-days (GDD) and the rate of change between events or locations are also interpreted as vector gradients. In turn, these vectors can be represented visually as shaded gradients, rendering the Farm Flow Board more like a gridded heat map than a Gantt chart.

The potential of this approach has not been fully explored but there is tremendous opportunity in what could be achieved by applying color gradients to depict the rate of change between cells – e.g., elapsed time, accumulated rainfall, or changes in soil moisture. Possibilities are not limited to color or the space between activities, but can make use of the size and shape of the markers or animations bound to a slider widget controlled by the user.

Each visual cue adds a new dimension for comparing the data. How might such gradients prove even more effective in a dynamic display, where the gradient colors can intensify and shift hue as the activity marker itself is moved back and forth across the grid in real time? To my knowledge, nothing like this exists in any existing crop planning applications. It may also be worth exploring other ways that gradient values could be represented on a spatial heat map or choropleth that allow for greater accuracy and emphasis to be placed on the geographic relationships rather than temporal ones.

It should also be stressed that this doesn't preclude typical Gantt-style representations, only that a significant source of value could be lost if Gantt-style blocks are prioritized over heat-map-style gradients, at least until proven otherwise. Gantt charts are already offered by several crop planning apps already on the market today, but the heat-map approach has yet to be exploited.
The value a user assigns to these features may depend on the type and number of crops they have in production, their farming practices, and the overall scale of their farm, particularly where these may differ from to Fitzgerald Organics. A smaller farm growing a larger number of specialty crops might value geographic groupings less highly, or may not adhere to such strict sequences between activities. It is possible, we have to admit, that by focusing on this single value proposition, Farm Flow may limit the diversity of farm types that find it uniquely appealing or helpful; however, that could also be the key factor allowing Farm Flow to thrive within a distinct, untapped niche, rather than struggling to compete within crowded field. It's also quite possible that the core visual and algorithmic characteristics – specifically, rendering gradient values across a 2D plane that correlates to calendar days and geographic space – could be generalized to render other datasets, plus the user scenarios they represent, so long as they can be mapped to a 2D vector space and scalar gradients. By perfecting its unique features over the long term and adapting its specialized views to more generalized datasets, Farm Flow may never want for a broader range of appeal. This niche-based approach, when combined with an emphasis on data portability and openness, could offer the best of both worlds, where farmers of all sorts can enjoy the specialized features of Farm Flow and defer to other applications for more a more generalized user experience.
The SOPs may in fact provide the ideal delta values for sorting the rows and determining gradient visualizations. As explained in the next section, the key to these SOPs is specifically the way they represent user-defined criteria for evaluating the board's primary data points – that is, the activities themselves – which are basically instances of different classes of SOP.
SOPs as User-defined Algorithms
Standard Operating Procedures, or SOPs, are the second core competency identified in Runrig's initial assessment. The SOP, as the general form of an activity, should be distinguished from the activity itself, which is merely one instance of the SOP that has been scheduled or completed. Each SOP is in essence a user-defined algorithm for how to perform a vital task, meant to achieve a corresponding and observable outcome, impacting the overall success of the crop.
Just as important as the individual SOPs are planned sequences of SOPs (or perhaps "SOP Flows"?) that the user determines should be carried out in order to achieve a desired outcome for the crop as well as the soil and other environmental factors. Like the individual SOPs, these sequences should be defined by the user, rather than hard-coded into the system by developers.
Taken all together, SOPs and SOP Sequences, along with their constituent target values, are effectively algorithms as user data, and the user should be granted the same right to control, modify, share, or keep them private just as they would any other form of user data.
Target Values, Outcomes & Metrics
SOPs and SOP Sequences are rulesets with distinct values that correlate directly to the tasks and activities they are meant to guide. An SOP may define certain target values that can be achieved by a single task, such as the spacing of plants or the flow-rate of an applied input. These will often differ from the observed values that are recorded upon the task's completion. Target values can also be assigned to intervals and deviations between multiple tasks, such as elapsed time or changes in soil moisture, temperature levels, or crop height. Finally, there can also be target and observed values for the total outcome of a given crop and its associated activities, such as the total yield, days-to-maturity (DTM), or more qualitative attributes like the crop's moisture density or coloration. Beyond individual crops, values can also be aggregated to represent a particular crop type, seasonal harvest, or multi-year environmental impacts.
Deviation values between the target and observed values can be used to judge how closely a set of activities adhered to their respective SOPs. They can also indicate the overall efficacy of a given SOP, or a modified version of an SOP versus its original. This provides a metric by which to judge SOPs themselves. For example, an SOP Sequence for a given crop might prescribe that flame weeding occur 6 days after rotary hoeing, but an alternate version of the Sequence changes that to 10 days after hoeing. As a result, the incidence of pests where the modified Sequence was used goes down by some quantifiable rate, say 15%, when compared to the rate of incidence where the original Sequence was used. That may be a valuable insight if it can be observed consistently under similar conditions. It may even be possible to perform a constrained optimization function on all of the variables to determine the optimal number of days under various conditions or for a desired outcome.
Any of these value types – targeted, observed, or deviation – can feasibly be visualized on the Farm Flow Board. A sort of positive feedback loop may thus emerge whereby SOPs become self-correcting in a sense. Perhaps even greater insight could be gleaned from the way an SOP's metrics trend better or worse given certain modifications, either in isolation or as a whole, sparking a vibrant exchange of SOPs and Sequences among farmers experimenting with different versions.
Version Control System
To reap the full potential of such metrics, it is critical that SOPs implement a version control system (VCS), with the ability to store, traverse, branch, and restore the version history. This applies not only to individual SOPs, but to Sequences of SOPs, where two Sequences may share the exact same SOPs in the exact same order, but may yet differ in which versions of those SOPs it includes, even if just one SOP differs.[1]
SOP Studio & Marketplace
In future development, users might be provided with a SOP Studio for creating, modifying, and updating their SOPs and Sequences based on previous crops and experience, with the full range of benefits a VCS can provide. Paradigms for how to graphically represent version histories and empower users to perform complex operations on them are already well-established, from Git to Google Docs. This may not be achievable in the first few stable iterations of Farm Flow, but can be anticipated and accommodated by incremental development. As an initial step that can preserve rudimentary version history from the very start, farmOS Taxonomy Terms (or a similar taxonomic data structure) could be used to model SOPs and Sequences as two distinct vocabularies that can be stored with their associated crop plans. The actual SOPs themselves, meaning the specific set of rules and target values assigned to each term, can be embedded as PDF files or plain text, not necessarily as structured data. That granularity of detail can be added later, but it is far more important that a chain of history be established from the very start.
By establishing that SOPs and Sequences are algorithms and data, defined and owned by their users, they could also be exchanged in a sort of SOP Marketplace. This is where the metrics for certain SOP versions may potentially become even more valuable. Prior to sharing the rulesets and target values for SOPs, their metrics can be shared with other users as a potential selling point. These metrics could even be compared and verified from the aggregated data of multiple users without exposing original or sensitive data. Less competitive use cases could be envisioned where such metrics are shared cooperatively within trusted communities of users.
Case Study: Ravelry as a Marketplace of User-Defined Algorithms
It may seem like a remote comparison at first, but the knitting website Ravelry provides an interesting case study as a parallel to the SOP Studio and Marketplace concept.
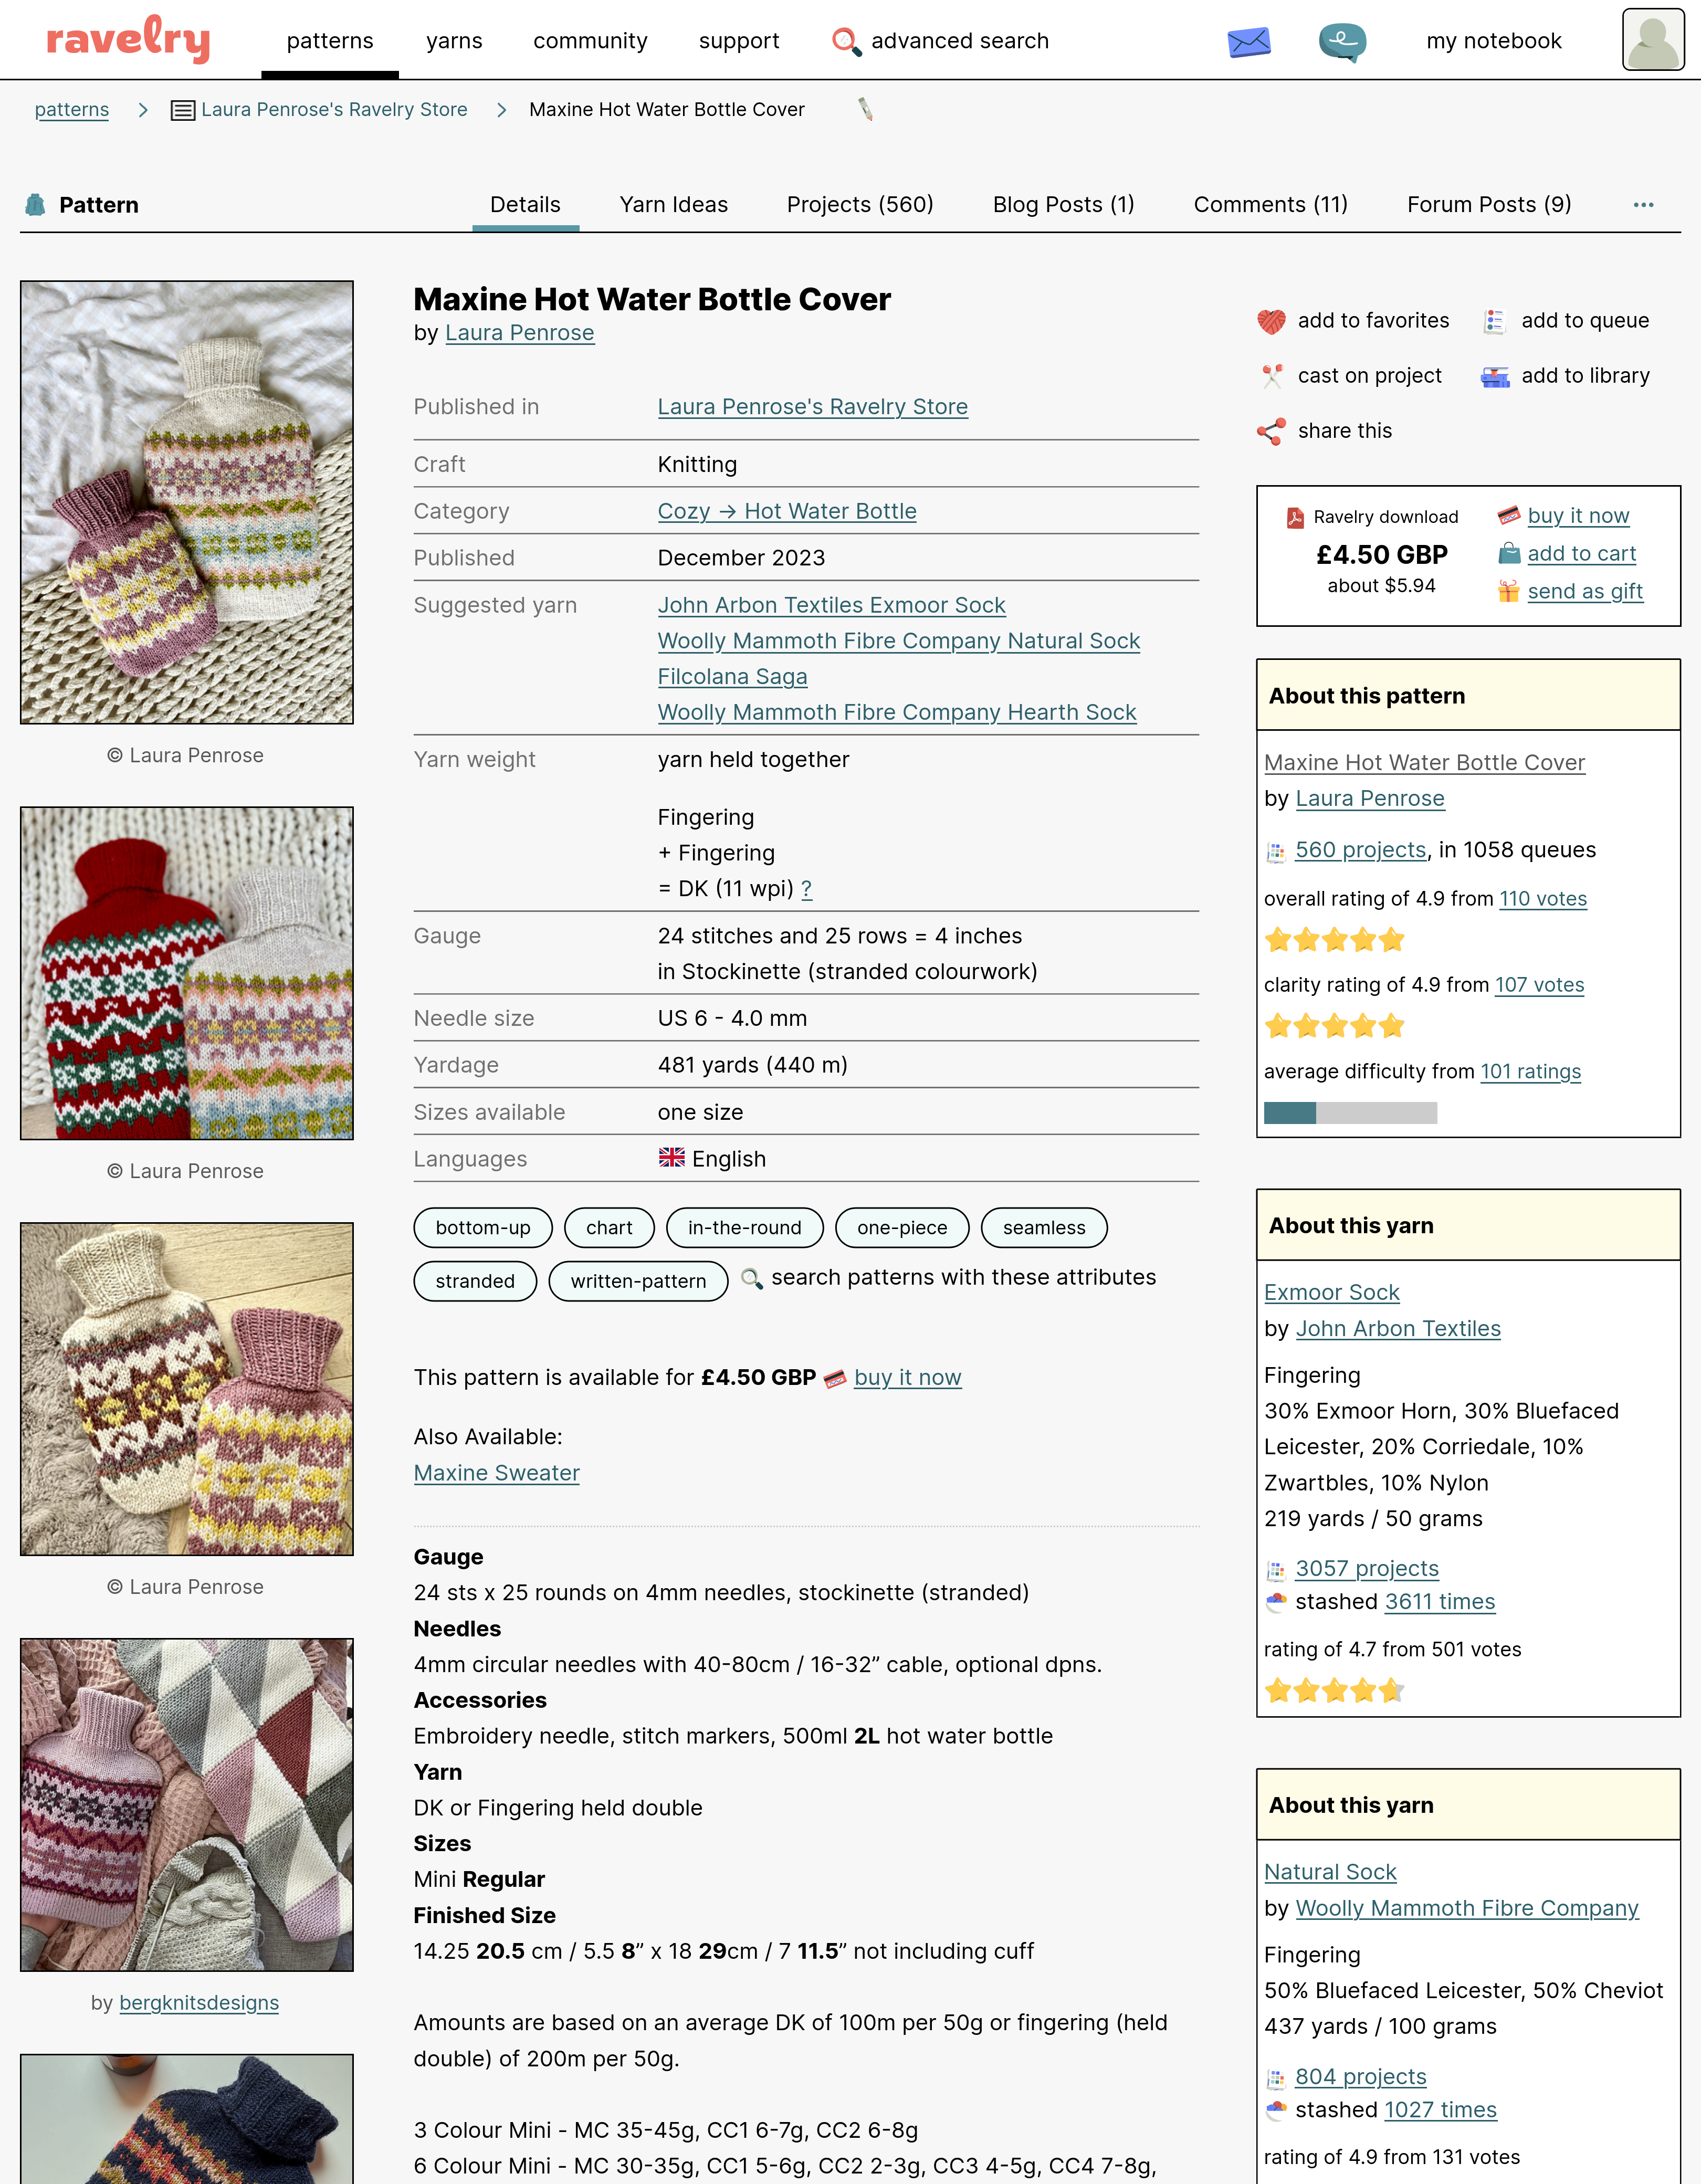
Ravelry is an online community and marketplace for sharing and selling knitting and crochet patterns. Patterns can be searched by category, tags or favorite pattern creators, then sorted by various ranking criteria or metadata. Patterns can be saved to PDF or read as rich text directly from the website in standard knitting notations, along with diagrams, images, and video to illustrate various techniques. Some patterns are free, while others can range in price. Once purchased, each pattern is added to the user's personal library where they can upload pictures and notes in order to record their experience using the pattern. Users can choose to show off the results of their handiwork by posting their pictures, ratings, and reviews, all of which link to and are displayed on the pattern's info page. Ravelry brokers these exchanges for a percentage of each pattern's sale price, which is their primary revenue stream. The company is notably small yet dominant among knitters from North America and Europe, as Maciej Ceglowski of Pinboard remarked as early as 2013:
Ravelry is a great example of a husband and wife team that eventually grew into a small company. Every once in a while a startup in Silicon Valley gets cocky and tries to take down Ravelry and take over the "knitting vertical," as they call it. About six months later they get their ass handed to them in a beautifully crocheted little bag with a bow, because Ravelry is secretly a social network and not just a place to exchange patterns.
The obvious parallel is the way patterns are exchanged, which mirrors the method proposed above for SOPs. Perhaps more importantly, however, Ravelry's story illustrates how a very strong enterprise can be built up without Venture Capital or by scaling to Silicon Valley proportions; this was the underlying intent of Ceglowski's whole presentation (hence the title: "Barely Succeed – It's Easier!"). The key difference in Ceglowski's view (and ours) is that the company's leadership identified strongly with the community they were aiming to serve from the very start. Thereafter they deliberately encouraged the health and growth of that community. It is the critical factor in their continued success and why they remain the go-to source for knitters to this day.
Actively Promote Data Portability
Farm flow should not only enable but actively encourage users to import and export their data between Farm Flow and other platforms. This includes uploading and downloading data as flat files (CSV, JSON, YAML, etc), but also through networked API services. Such services could be used to provide users with an OAuth-enabled setup "wizard" that allows one-time permission grants to transfer data, or even with continual syncing services between one or more devices.
Benefits
Fully automated, user-facing features for syncing and transferring data over the network are by no means trivial. They may not be practical to achieve in a first stable release or for several iterations after that; however, there are both short- and long-term benefits to adopting portability as a design mandate from the offset, especially when it comes to establishing a data model and migration policy for the first stable release. The benefits can be separated into three general categories, as they pertain to Farm Flow:
- User freedom will be enhanced, including their freedom to try Farm Flow in the first place, due to lower up-front switching costs and alleviated concern over vendor lock-in should they ever choose to leave.
- Farm Flow itself will be less susceptible to vendor lock-in by third-party libraries and services, as well as hosting providers.
- New synergies can be activated within the wider ecosystem of free software platforms, which can diffuse the costs of development and introduce complementary services that boost Farm Flow's appeal.
It is all the more critical to capitalize on these benefits in order to fully realize the gains of free and open source software as a development strategy. This can be taken even further to the concept Cory Doctorow calls Adversarial Interoperability, where robust APIs and other interop tools can be employed against proprietary cloud services to ward off attempts by Big Tech monopolies to further consolidate the market and turn the tide even towards a freer internet.
Heuristics for Data Portability
To achieve these benefits, a few rules of thumb can be helpful:
- Data import/export as a first-order feature
- Model Transparency & Schema Consistency
- Compatibility with Industry Standards
First-order Import/Export
Ultimately, users should be able to take data in and out of the application as smoothly as possible, but as an absolute baseline, they should have the option to import and export their data in a simple flat-file format like JSON, YAML, or CSV. To be clear, this is not recommended as a long-term solution for a number reasons: there may be little else they can do with exports other than view it in a spreadsheet, and the trouble of manually formatting data for import may well outweigh the benefits; basic versioning and data migration will prove daunting, with more advanced options like synchronization pretty much off-limits. However, the critical thing is to approach portability as a first-order feature that can be improved upon iteratively with each pre-release.
First-order import/export can help inform early decisions, leading to greater consistency in the data model, higher fidelity to the user's mental model, and fewer obstacles to data portability later in development. Alpha and beta testers should be active participants in the domain modelling process, creating a deeper understanding and sense of trust between the domain experts (users) and domain modelers (developers). This in turn can lead to further cooperation and stronger commitment over time. A favorite practice in this regard is the "Show Your Spreadsheets!" workshop, where willing participants can their present the spreadsheets they currently or previously used to organize their operations. Farmers can advise developers on their own experience, lessons they've learned, and the critical nuance of various strategies they've tried. In turn, developers can offer advice on ways to structure data more effectively and suggest ways that their spreadsheets can be imported to Farm Flow without the loss of data or any nuance. Ideally, that means less effort on the user's part when it comes to importing and exporting their data. This process can aided in adopting a few techniques from Domain Driven Development (DDD), such as the use of a ubiquitous language and bounded contexts.
By the time of the very first general release, users should have a reasonably smooth pathway to importing existing data from other platforms into Farm Flow. This is a clear gain in its own right, since it can greatly simplify onboarding, but it also opens up a pathway for interoperability between the platforms farmers were using in the past and those they may wish to use in conjunction with Farm Flow. User-share doesn't have to be a strictly zero sum game, not where complementary platforms are open to collaboration and exploiting separate niches. By its very nature, such an approach especially favors other free software platforms. Meanwhile, users will also be more inclined to migrate to Farm Flow by knowing they always have an escape hatch to export their data at any time, with the prospect of keeping their data synchronized across platforms as a top priority of future development.
Model Transparency & Schema Consistency
Portability can be made far easier in the long term with a clearly delineated and accurate means of publishing the schemas for critical data objects, both in the form of documentation and APIs that can be accessed programmatically. There are plenty of alternatives for achieving this, but given Farm Flow's elected backend stack of NestJS, Prisma, and SupaBase, we'll make some specific recommendations here that make use of their built-in utilities:
- NestJS OpenAPI Module: NestJS provides an official OpenAPI module, which can be used to publish documentation of you APIs in the form of a machine-readable OpenAPI YAML or JSON document, as well as the Swagger UI, hosted for either private or public access on your website. This can be helpful for Farm Flow's internal team, but doubly helpful for third-party developers wishing to connect via RESTful API services.
- Prisma Schema's Data Model Definitions: For community developers who wish to contribute to Farm Flow, submit a pull request, provide an extension, or merely adapt elements of its data model to their own applications, the ability to view the data model in a typed Data Definition Language (DDL) can be more helpful than the OpenAPI documentation. Of course, other DDLs, TypeScript, or even pseudo-code could be used, but as the chosen ORM for Farm Flow, the Prisma Schema and Prisma
modelobjects seem like a natural choice. - Documentation Generator: Of course, as a free software project, Farm Flow's Prisma Schema should be accessible as the
schema.prismafile(s) in its source code repository; however, the ideal location to publish these schemas would be alongside the rest of Farm Flow's documentation. This could also include other API reference material that can be automatically generated directly from the source code as a part of a Continuous Integration or Development (CI/CD) workflow. A Prisma community generator is available,prisma-docs-generator, which seems to do precisely that, though surely other viable solutions exist as well.
Other Modelling, Schema & Ontology Tools
These tools are more generic but may be worth exploring:
- JSON Schema: A schema definition language for JSON data, written as JSON. OpenAPI/Swagger uses a dialect of JSON Schema for its own schema definitions.
- Ajv: A widely used JavaScript library for JSON Schema validation.
- Zod: "TypeScript-first schema validation with static type inference"
- LinkML: "LinkML is a flexible modeling language that allows you to author schemas in YAML that describe the structure of your data. Additionally, it is a framework for working with and validating data in a variety of formats (JSON, RDF, TSV), with generators for compiling LinkML schemas to other frameworks."
- Atomic Data: "Atomic Data is a modular specification for modeling and exchanging linked data. It uses links to connect pieces of data, and therefore makes it easier to connect datasets to each other, even when these datasets exist on separate machines. It aims to help realize a more decentralized internet that encourages data ownership and interoperability."
- Cap'n Proto Schema Language: Almost surely overkill, but Cap'n Proto is an Interface Definition Language (IDL) from the creator of Protocol Buffers (protobufs), with a powerful RPC system rooted in Capability-based Security.
Industry Standards
Apart from making Farm Flow's own data model and schema more accessible to community contributors and third-party developers, there are a number of industry standards and data models already widely available that can facilitate data portability and reduce overall costs:
- farmOS Data Model The farmOS project has a well-established open data model that has been used by a diverse range of farms and organizations, inlcuding the USDA/NRCS Soil Survey, the Pennsylvania Association for Sustainable Agriculture (Pasa), Rothamsted Research, the Savory Institute, Bionutrient Food Association, and the the US Forest Services International Programs. That is to say, adoption of the farmOS Data Model can afford tremendous opportunities for portability and collaboration among platforms. It is a generic, flexible, and broadly applicable Entity-Relationship, or ER, model that can be adapted to a wide range of farm settings.
- DFC Standard: The Data Food Consortium publishes semantic data standards related to food and agriculture, currently comprised of a business ontology and a product ontology with plans for a production ontology in the near future. There probably wouldn't be a reason to implement either the business or product ontology in Farm Flow, given its current feature requirements, but even before the production ontology is available, it could be worth familiarizing Farm Flow's developers with DFC's approach.
- AGROVOC: From the UN's Food & Agriculture Organization (FAO): "AGROVOC is a relevant Linked Open Data set about agriculture available for public use and facilitates access and visibility of data across domains and languages. It offers a structured collection of agricultural concepts, terms, definitions and relationships which are used to unambiguously identify resources, allowing standardized indexing processes and making searches more efficient."
- NALT: "The NACA data shapes project is a project commissioned by the USDA to apply linked data principles to agricultural data."
- IC-FOODS: Their Produce Data Project provides "an informational framework and data guidelines to increase the consistency of naming and data conventions to aid smaller producers and producer networks in becoming 'wholesale ready.'" As with the DFC Standard, this might not be strictly relevant to Farm Flows use cases, but could offer some helpful examples.
Many other relevant standards and protocols exist which can be recommended upon request, suited to match more specific criteria.
Compatible Software Projects & Organizations
The following free software projects and organizations may offer the opportunity for fruitful collaborations with Farm Flow:
- Brinjel: Brinjel (formerly Qrop) is a free software project sponsored by L'Atelier Paysan and as a web-based tool for visualizing crop plans in a Gantt-style chart, is probably the closest free software analog to Farm Flow's intended use case.
- LiteFarm: "LiteFarm is a free and open source farm management tool made for current and aspiring sustainable farms. It was built by farmers and researchers coordinated by the University of British Columbia to address many of the challenges in farm management. It’s currently being used to manage farm operations in more than 155 countries."
- farmOS: "farmOS is a web-based application for farm management, planning, and record keeping. It is developed by a community of farmers, developers, researchers, and organizations with the aim of providing a standard platform for agricultural data collection and management."
- The Open Food Network: OFN is "open-source software to manage online farmers markets," with separate server instances in over a dozen countries
- OurSci: Creator of tools such as SurveyStack, SoilStack, and the Our Sci Reflectometer
Additionally, the Gathering for Open Agricultural Technology, or GOAT, is an active and thriving community of practice, comprised of volunteer members across industry, government, and academia. The GOAT forum, in particular, is an excellent resource and opportunity for engaging with farmers and open source developers alike. OpenTEAM is an organization that's part of the Wolfe's Neck Center for Agriculture & the Environment. With the possible exception of Brinjel, all of the software projects listed above are active participants in both GOAT and OpenTEAM.
Embrace Software Freedom as a Business Model
Free software – that is, software that users are free to share, modify, and use however they see fit – can be far more than just an ethos, at least when done with care. It can be a powerful strategy for organizing limited resources and disparate contributors to develop effective tools that can far exceed what's possible with proprietary software. However, it requires putting aside a few assumptions that can spill over from the proprietary models. Some basic guidelines and best practices are provided below, but a more thorough-going exposition of Runrig's methodology can be made available upon request.
Licensing & Terms
- License: Adopt the GNU Affero General Public License, Version 3 (AGPLv3) for all server and client-side code. This will at least ensure that if any competing instances or forks of Farm Flow are hosted, they must adopt a compatible license and abide by comparable standards of software freedom as the Farm Flow project itself (this is the "copyleft" principle, one that is unsupported by other open source license such as MIT or Apache 2.0). The text of the AGPLv3 should be included at the root of all source code repositories as a
LICENSEfile. - Licensed Dependencies: Wherever possible, if using dual license or open core software dependencies, favor those components that have a license approved by the Open Source Initiative. Even if Farm Flow elects to hire managed hosting, there should be a clear pathway to a self-hosted solution without undue cost of refactoring the existing codebase, should the need arise. For instance, refer to Supabase's "Self-hosting" guidelines for the paid services available on their platform that can also be freely self-hosted.
- Trademark & Attributions: Include the Farm Flow trademark statement in the software user interface, public facing marketing and documentation sites, and in the root directories of software repositories for Farm Flow. Wherever other groups or organizations are attributed – such as Cloudburst, 11th Hour Project, Mad Agriculture, or Runrig – make sure to clearly distinguish their contributions so not to be mistaken for the owner of the Farm Flow trademark or its services.
- Terms of Service & Data Policies: Advise a lawyer with regard to the adoption of Terms of Service and other service level agreements. They should also take into consideration licensing and trademarks attributions, as previously mentioned, as well as jurisdictional compliance, ethical assurances, or any other data policies you choose to adopt that may be considered legally binding.
Auditing & Compliance
- GDPR Compliance: Even if Farm Flow never intends to market the service in Europe, GDPR compliance should be adopted as an act of good faith to potential users. If Farm Flow is actively marketed in Europe or analytics are collected for site visitors that do not otherwise register under the Terms of Service, third-party GDPR certification should be considered as well.
- Ethical Data Use & Assurances: Adoption of the FAIR Data Principles or OpenTEAM's Agriculturalists' Bill of Data Rights is also highly recommended and the projects technical leads and engineers should be familiar with the principles and how they may be implemented. In this regard, Runrig can advise in greater detail and conduct acceptance testing upon request.
- Third-party Security Audit: At the point of an initial stable release (1.0.0), it is highly recommended that Farm Flow hires a third-party security auditing team, in addition to internal security audits.
Transparency & Accessibility
- Documentation: Documentation should include basic instructions and requirements for setting up a local development environment and deploying an independent server instance. Important architectural decisions and style guidelines should also be included, as well as reference material for any external APIs.
- Publishing Documentation & Updates: At minimum, developer documentation should be co-located with its relevant source code repositories, with
READMEandCHANGELOGfiles placed at the repositories' root directories, written in either Markdown or plain text. Additional pages can be included in a clearly marked subdirectory, such asdocs/. Ideally, documentation should also be rendered to an independent website by the time of a first stable release (1.0.0), either as a subsection of Farm Flow's marketing site or as a subdomain. Details from the changelog can be included in release notes, depending upon distribution method. - Community Guidelines: Along with the
README,CHANGELOG, andLICENSEfiles, documentation should also include aCONTRIBUTINGfile, aCODE_OF_CONDUCT(CoC), and other helpful information for potential contributors. These should indicate where bug reports and other technical issues can be opened, as well as more informal discussion topics and inquiries. The Good Docs Project has a wide array of guidelines, templates, and articles that can help in this matter. The Contributor Covenant is also an excellent CoC that can be adopted to promote healthy community relationships.
The complex relationship between different versions of SOPs and SOP Sequences could be represented internally as a directed acyclic graph (DAG), which is how Git performs version control, or as a Merkle Tree, such as how cryptographic hash-based signatures are constructed or how content-addressing is performed in systems like IPFS and IPLD. However, these are details that need not be exposed to the end user. ↩︎